 AntiFreeze.NET user manual: Statistics AntiFreeze.NET user manual: Statistics | Index | Project page |
| AntiFreeze.NET user manual: Statistics | Index | Project page |
Statistics are stored while any of threads capable to store it works. Such threads currently are: Ping Monitor and Traffic monitor.
Every statistics graph is divided by blocks by horizontal axis. One block represents one of calendar or time units. Graph also shows approximate value change inside of blocks. Minimal scale is one hour per block. More precise statistics are not available. If real statistics count is less than hour, if will be expanded to one hour. In this case proportions will not be saved. If scale is larger (4 hours per block, one day per block or more) actual data count per block also will be expanded to fill whole block. You can see 3 days long graph on image below. It doesn't mean that Ping Monitor thread was running for 72 hours. It might be running for 5 minutes every day (or any interval enough to store at least one statistics block). AntiFreeze.NET cannot force user to keep it running for whole day for seven days per week, but statistics will be as full as possible.
You can zoom in and out statistics (see image below). To zoom, in you should select range where to zoom. Zoom out brings zoom back in history.
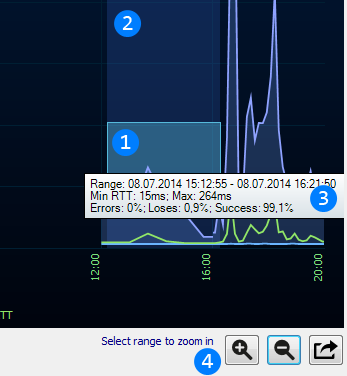
 Mouse controlled selection rect. It will automatically select all blocks with data. You can select with this way by pressing left mouse button
and dragging mouse pointer. To stop selecting, just release mouse button. You can select even data inside of blocks. Selection start and end positions will be rounded to closest data position
inside of the block.
Mouse controlled selection rect. It will automatically select all blocks with data. You can select with this way by pressing left mouse button
and dragging mouse pointer. To stop selecting, just release mouse button. You can select even data inside of blocks. Selection start and end positions will be rounded to closest data position
inside of the block. Actually selected blocks or data inside of the blocks. When you use zoom, app will use this selection as range for new zoom.
 When selecting, hint shows range info for all selected blocks. You can use it to measure data in whatever you want range.
 Zoom in, zoom out and export buttons. This buttons are common for all statistics dialogs. See "Export" window.
Ping statistics can show actual RTTs collected by Ping Monitor thread. Graph will show minimal and maximal RTT and fill space between them indicating that RTT was somewhere there in this period of time.
See Ping Monitor thread.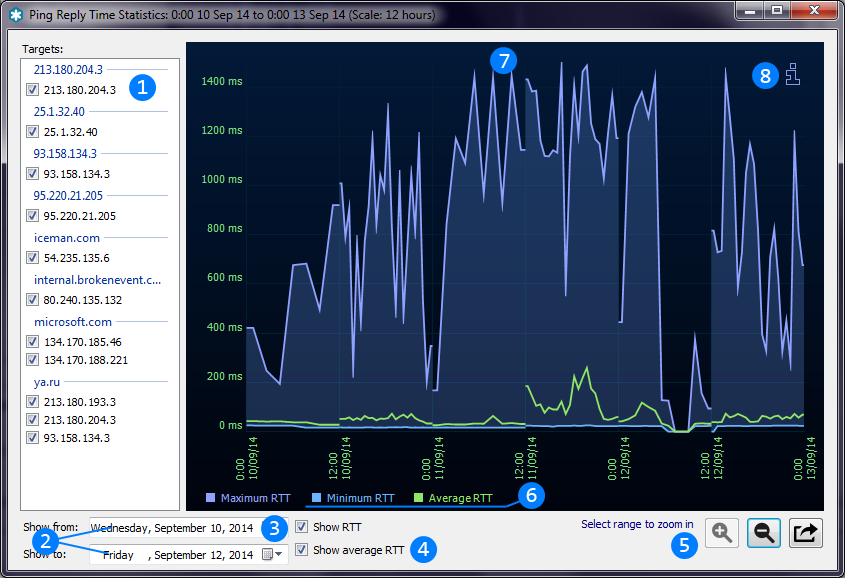 Grouped list of destination hosts. You can filter and show statistics for only necessary hosts.Start and end points of showing range. You can alter current view by changing this values.Show RTT checkbox switches statistics between RTT and loses/errors view.Show average RTT checkbox enables and disables average lines.
 Zoom in, Zoom out and Export buttons are common for all dialogs. See details above.
 Graph legend showing meanings of any lines on graph. Legends updates with view change (mode change and etc.).
 Graph showing statistics for current range.
 Information region. Hover this icon to get information for all visible range.
Ping statistics have also alternative mode of view (Show RTT checkbox (4)). In this mode it shows percent of ping loses and errors for periods of time.
Traffic statistics shows amounts of data sent and received by interval of time. If scale is large, it will show sum for periods and split values into different time intervals when zoom in.
See Traffic monitor thread.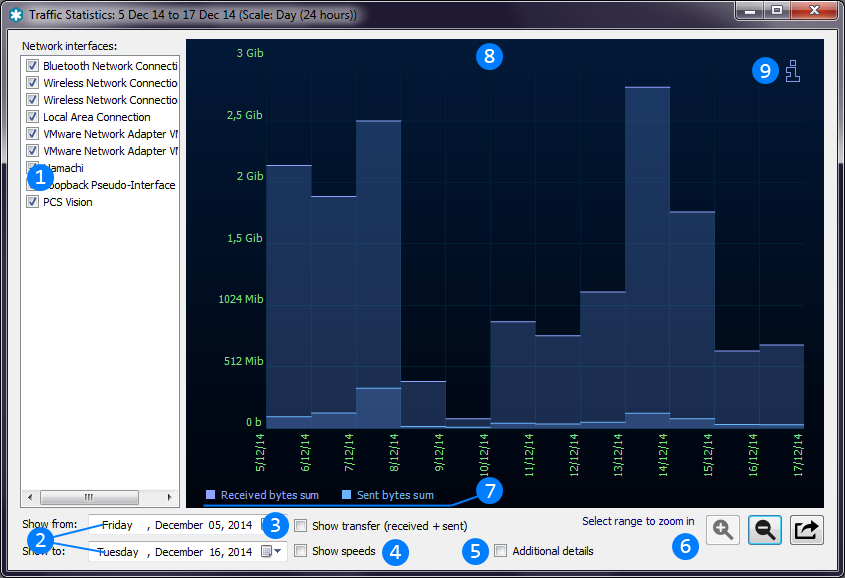 Network interface list. You can filter and disable showing data for interfaces you don't need. Statistics are stored by sum for all interfaces. So filters are applied partially.Start and end points of showing range. You can alter current view by changing these values.When Show transfer checkbox is checked, statistics will show sum of sent and received data (or send and receive speed) and separate this values it not.Show speeds checkbox switches statistics between traffic and speed view.Additional details checkbox enables and disables additional detail lines on graph. They are: maximum speeds for speed view and traffic values inside of the block for traffic view.Zoom in, Zoom out and Export buttons are common for all dialogs. See details above.Graph legend showing meanings of any lines on graph. Legends updates with view change (mode change and etc.).Graph showing statistics for current range.
 Information region. Hover this icon to get information for all visible range.