 AntiFreeze.NET user manual: Threads list AntiFreeze.NET user manual: Threads list | Index | Project page |
| AntiFreeze.NET user manual: Threads list | Index | Project page |
All AntiFreeze.NET functions use "thread" model. Every action you made is called "thread" (and it's really a thread (See Wikipedia "Threads"), if you familiar with programming). Several threads can be running at the same time and its count doesn't affect interface or functionality of application. You shouldn't think about it. Just remember that execution of one thread may take some time, but in that time you can run something different and they will not interfere.
Some of them just does something and closes and some of them are "endless". Endless threads will continue until user close them or application close. This separation is based on threads purposes - some threads will made only one action (change something or get some information). And some of threads will do something useful (collect information, draw graphs, gather statistics and etc.) while they run. For example, Traffic monitor thread will collect info and draw graph all the time while it run. At any time you can open its tab and see how much traffic and with which speed your PC was sent and received. Endless threads have additional buttons on its headers (See also "Header").
Threads also differs with a way them show results. Some of them just print their info to the main console. And some of them creates their own tabs when results are too large or just not only text info. For example, the result of Get external IP thread is just IP address (with some additional hints, not only IP, but "This is your external IP address: 127.0.0.1"). Creating another tab with console for such one line of text is useless and there will be tens of such tabs to be confused. If thread will show some formatted (table for example) results - it will create its own tab to show them.
For search simplification threads are separated by categories:
This topic contains list and description of all threads in AntiFreeze.NET.
Some threads can execute some actions on its intermediate data and results. Actions will allow copy to these data to clipboard, show in Text View window and other. Actions can be accessed with Thread menu or its submenu. Also actions can be accessed with Lighting icon on thread tab in Main window header. You can execute actions by clicking their commands in Actions menu (or submenu).
Diagnostic threads are used to diagnose network connection or settings.
Ping Monitor thread is used for permanent control of network connection or availability of some servers. Usually, when user needs to test if some host is accessible (or how well it is
accessible), he uses standard system utility ping.exe (and not only Windows users do so). For such meanings system ping utility is even better than AntiFreeze.NET due to its lightness and
simplicity. But when you need to check connection for a long time or get statistics of round trip time and percent of loses, you need to have something different. AntiFreeze.NET's ping
thread is created just for such application. It can't send a few pings and die, but can be running and testing connection for a long time and show the graph of RTT and loses/errors all the time. Ping
Monitor thread also can be used as keep-alive system.
See also Wikipedia "Ping".
You can start (and add to default presets) a few ping threads at same time to test connection with different hosts (or test if they're alive).
Image below describes Ping thread configuration window.
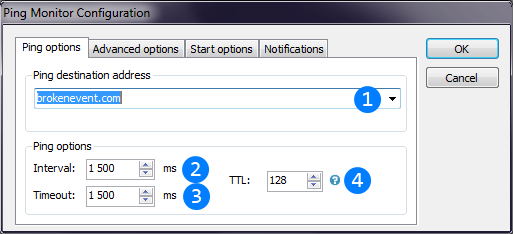
 Destination address (IP-address or hostname) to send pings.
 Interval is time between thread sends pings. Small intervals may load your network connection, bigger intervals makes less precise statistics.
 Ping timeout is time after which ping packet is counted as lost.
 ICMP packet Time-To-Live setting. TTL (hop limit) is count of hosts that packet is able to reach. If target host is too far away, packet with low TTL will be unable to reach it.
Also there is a strange WinAPI behavior when sometimes ping replies are returned after timeout is reached. Ping Monitor thread also detects these "wrong" replies. For more detailed information you can click left mouse button on Ping graph to switch to log view where you can see details for any of replies received.
You can also configure storing of statistics and tray animation of Ping monitor thread. Image below describes these settings.
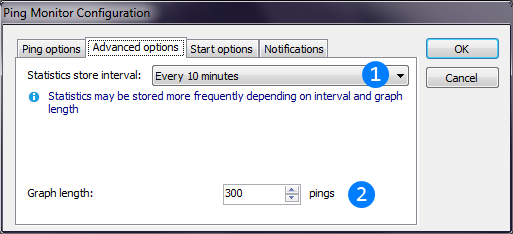 Ping thread will dump collected information to DB every specified period. In case of data loss prevention, data may be stored even more frequently.
Count of samples in graph. Data samples will be scaled to fit graph width in pixels.
Warning: this value can only be changed when thread starts and cannot be changed while it is running.
Ping thread will dump collected information to DB every specified period. In case of data loss prevention, data may be stored even more frequently.
Count of samples in graph. Data samples will be scaled to fit graph width in pixels.
Warning: this value can only be changed when thread starts and cannot be changed while it is running.If AntiFreeze.NET starts on Windows start, it can start earlier than network appear, so internet connection will not be present when Ping Monitor starts. In this case Ping Monitor could not reslove IP address of the ping target. Ping Monitor will retry DNS requests until hostname will be found or count of tries exceed. "Start options" tab is used to configure this startup behavior:
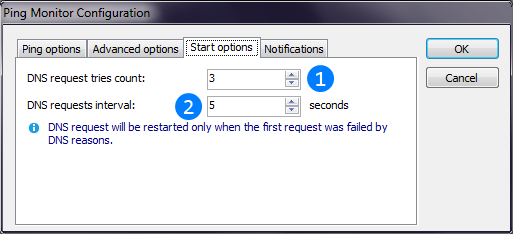 Count of requests to DNS until thread fails. For startup threads you can increase this value to wait until internet connection appear.Time interval, in seconds, between DNS request retries.
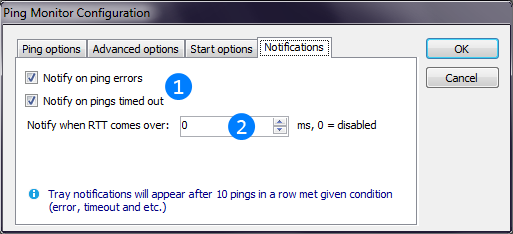 Checkboxes enables tray notifications when 10 pings in a row become lost or are returned with network error.Enables tray notification when RTT of 10 pings in a row become high.
As thread with graph, Ping Monitor has its own graph settings based on defaults from AntiFreeze.NET settings (See also "Settings" window). You can configure them from thread's menu (See also "Thread" menu) and they are stored when you save thread as preset.
Ping Monitor thread can be configured in runtime. Ping Monitor thread is endless, so it can't stop by itself (only with app) but you can stop it manually by clicking "Close" button on its header (See also "Header").
Routing table thread displays current routing table. This diagnostic tool allows to view start packet directions (first hop) from your PC. Thread has no configuration.
See Wikipedia "Routing table".Actions allows to reread mapping table, to add new route and to calculate the best route for the given destination IP (will return the the first hop of the best route). Image below explains "Add route window":
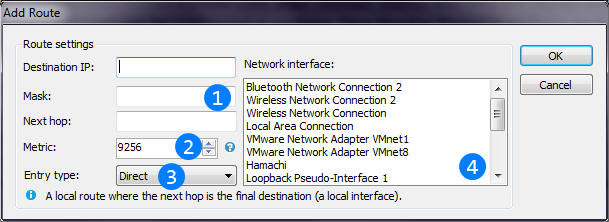 First three textboxes allows to enter destination IP of the route, subnet mask and the first hop IP address.Metric of the route describes its priority in calculationEntry type describes route's type in the table. See description below the combo box.List is used to select the local interface through which the next hop of this route should be reached.
Context menu for each mapping entry allows to delete it.
AntiFreeze.NET Trace route thread is very similar to system trecert.exe utility (See also Wikipedia "Traceroute") with some difference:
Trace route sends not one, but a few (configurable) ICMP packets (pings) to each host on the route to detect its IP. In case of first packet(s) fail, one of them still can be capable to determine host's IP address. Moreover, Trace route thread checks connection for each intermediate host (called route node or node) by sending a few pings (See also Wikipedia "ICMP") to detect its latency (or simply RTT) and lose level between starting host and this node. This may improve precision of diagnostics problems on the route.
Image below explains Trace route thread settings window.
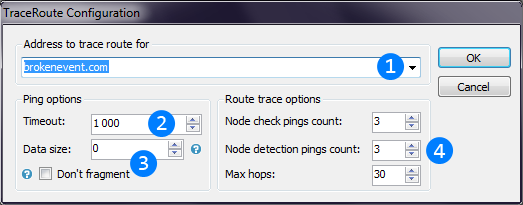 Destination address (IP-address or hostname) to determine and diagnose route to.Ping timeout, time after which ping packet is counted as lost.ICMP options like Data size and Don't fragment flag allows to check MTU of the intermediate
route nodes. Data size is the number of bytes to send with each ping. Don't fragment flag disables packet fragmentation, so if the packet size exceeds MTU of one of the nodes,
the packet will return with error.Route trace options group allows to configure count of pings to detect connection latency to each node, maximum count of pings will be send to detect next node (hop) IP and
maximum hops for all route.
Destination address (IP-address or hostname) to determine and diagnose route to.Ping timeout, time after which ping packet is counted as lost.ICMP options like Data size and Don't fragment flag allows to check MTU of the intermediate
route nodes. Data size is the number of bytes to send with each ping. Don't fragment flag disables packet fragmentation, so if the packet size exceeds MTU of one of the nodes,
the packet will return with error.Route trace options group allows to configure count of pings to detect connection latency to each node, maximum count of pings will be send to detect next node (hop) IP and
maximum hops for all route.You can switch route table to console view by clicking left mouse button anywhere in thread tab (on route table). Console view contains information of all actions, pings and replies for all nodes on the route.
This thread will help you to determine which TCP ports of host can be accessible from the Internet across Firewalls, NATs and everything else on the route between Internet and the host.
Image below explains Port checker thread settings window.
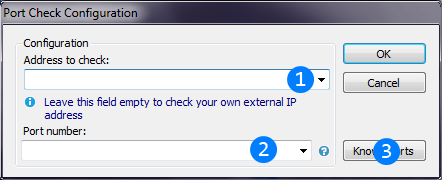 Host to check (IP or Hostname) its ports. You can leave this field blank to check ports of your own PC (in this case thread will firstly detect external IP).Port number(s) to check. You can set single port or a few at once. Fields allows to set port ranges m-n ("100-120", for example) and comma-separated enumerations of ports or
port ranges ("10, 50-60, 120", for example). You will not get result until all ports will be checked.Opens advice panel for ports of popular software. You can add ports from there by double-clicking on item.
Host to check (IP or Hostname) its ports. You can leave this field blank to check ports of your own PC (in this case thread will firstly detect external IP).Port number(s) to check. You can set single port or a few at once. Fields allows to set port ranges m-n ("100-120", for example) and comma-separated enumerations of ports or
port ranges ("10, 50-60, 120", for example). You will not get result until all ports will be checked.Opens advice panel for ports of popular software. You can add ports from there by double-clicking on item.Thread results (state of all given ports) will be printed to main Console. If there are a lot of ports to check, the operation may take a while. The operation time is limited to 5 minutes.
Informational threads are used to get useful information about network and its hosts.
If your IP address is not "white" from the Internet side, this thread can detect your external (on other side of NAT(s) or proxy) IP address. Thread has no configs and works automatically.
See Wikipedia "NAT".Thread result (external IP address) will be printed to main Console.
This thread is used to get MAC address for any host of your network by its IP address.
See Wikipedia "ARP".Thread result (external MAC address of target host) will be printed to main Console.
Host info thread is used to retrieve host information by its IP address. For now thread have two categories of information and its sources: DNS servers and WhoIs.
Image below explains Host info thread settings window.
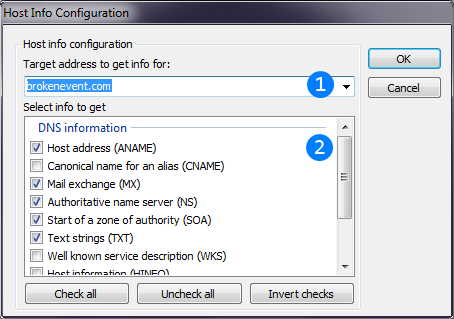 Destination host IP address.List of information items to retrieve. There are two groups of items: DNS records and WhoIs. Meanings of all types of DNS records are described in
Wikipedia. WhoIs data is full result of query to WhoIs database.
Destination host IP address.List of information items to retrieve. There are two groups of items: DNS records and WhoIs. Meanings of all types of DNS records are described in
Wikipedia. WhoIs data is full result of query to WhoIs database.WhoIs data could have different format, so it can't be precisely parsed, but WhoIs result guaranteed to be always human-readable.
Thread results will be printed to main Console.
Network info thread has no configuration and works automatically and almost immediately. It's results are similar (but more detailed) to system ipconfig.exe.
See also Wikipedia "ipconfig".Thread results will be printed to main Console.
This thread is used to quickly get IP-address for given hostname. As AntiFreeze.NET uses own DNS lookup implementation, result of this thread is system-independent. So except its direct purpose, this thread also can be used to detect some hacks or malware/adware when they changed system DNS lookup services behavior.
Thread configuration window allows to set the target hostname address to get its IP. Also you can select DNS server (by its IP) where to send request.
Thread result (IP address) will be printed to main Console.
This thread is used to quickly get hostname for given IP address. As AntiFreeze.NET uses own DNS lookup implementation, result of this thread is system-independent. So except its direct purpose, this thread also can be used to detect some hacks or malware/adware when they changed system DNS lookup services behavior.
DNS reverse lookup is not so reliable as desired, so even if hostname and IP pair exists, it may not succeed in all cases.
Thread configuration window allows to set the target IP address to get its hostname. Also you can select DNS server (by its IP) where to send request.
Thread result (Hostname) will be printed to main Console.
This thread is used to get vendor information of given MAC address.
Thread configuration window contains only one textfox for target MAC address. Three formats of MAC addresses are supported: dash-separated (00-00-00-00-00-00), colon-separated (00:00:00:00:00:00) and plain (000000000000).
See also MAC address lookup website.Thread results (vendor and location info) will be printed to main Console.
Traffic monitor is used to monitor traffic and speed of selected network interfaces. It allows to determine how much data was sent or received and with which speed.
Keeping Traffic monitor running all the time can give you full statistics of your traffic. See also Traffic statistics. If this information is important, it is recommended to save Traffic monitor as default preset and keep AntiFreeze.NET running all the time.
Warning: you cannot start more than one Traffic Monitor for single network interface. For example, if you've started Traffic Monitor monitoring Local Network Interface among of others, you can't start another to monitor this interface.
Image below describes Traffic monitor thread configuration window.
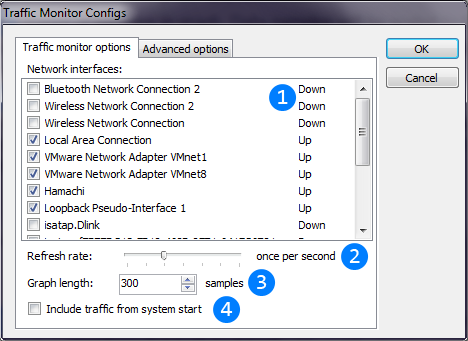 List of network interfaces to monitor. By default, this window selects all up interfaces.Refresh interval of Traffic monitor. It will retrieve traffic snapshots every selected intervals of time. Smaller intervals give more precise statistics (and more frequent samples on graph),
Larger intervals give less CPU usage, less data stored to DB and less precise graph and statistics.Count of samples in graph. Data samples will be scaled to fit graph width in pixels. Warning: this value can be changed only when thread starts
and cannot be changed while it runs.Changes initial traffic value. If checked, it will be sum of current traffic of selected network interfaces or 0 if unchecked. Warning: this value can be changed only when thread starts
and cannot be changed while it runs. Feature is disabled in Windows XP due to WinAPI limitations.
List of network interfaces to monitor. By default, this window selects all up interfaces.Refresh interval of Traffic monitor. It will retrieve traffic snapshots every selected intervals of time. Smaller intervals give more precise statistics (and more frequent samples on graph),
Larger intervals give less CPU usage, less data stored to DB and less precise graph and statistics.Count of samples in graph. Data samples will be scaled to fit graph width in pixels. Warning: this value can be changed only when thread starts
and cannot be changed while it runs.Changes initial traffic value. If checked, it will be sum of current traffic of selected network interfaces or 0 if unchecked. Warning: this value can be changed only when thread starts
and cannot be changed while it runs. Feature is disabled in Windows XP due to WinAPI limitations.You can change the way Traffic monitor manage and store statistics and use Traffic monitor as notification of traffic or speed overuse. Image below describes these settings.
 This textboxes allows to configure notifications when send or receive speeds exceed given values. Set both to 0 to disable notifications.This textboxes allows to configure notifications when sent, received or sum traffic exceed given values. Set all to 0 to disable notifications.Traffic monitor thread will dump collected information to DB every specified period.
In case of data loss prevention, data may be stored even more frequently. See also Traffic statistics.
This textboxes allows to configure notifications when send or receive speeds exceed given values. Set both to 0 to disable notifications.This textboxes allows to configure notifications when sent, received or sum traffic exceed given values. Set all to 0 to disable notifications.Traffic monitor thread will dump collected information to DB every specified period.
In case of data loss prevention, data may be stored even more frequently. See also Traffic statistics.As thread with graph, Traffic monitor has its own graph settings based on defaults from AntiFreeze.NET settings (See also "Settings" window). You can configure them from thread's menu (See also "Thread" menu) and they are stored when you save thread as preset.
Traffic monitor can be configured in runtime. Traffic monitor is endless, so it can't stop by itself (only with app) but you can stop it manually by clicking "Close" button on its header (See also "Header").
IP scanner may by useful to detect all hosts in the net or subnet. IP scanner supports two modes: fast and slow. In slow mode thread will send pings to every IP address scanned. If host doesn't answer (no such host or ping is disabled) it counts as nonexistent/offline. In fast mode thread will try to retrieve hostname for every IP scanned. If DNS is unable to return hostname - host counts as nonexistent/offline. If DNS returns hostname - thread will still ping this IP to ensure host is currently online. DNS will return hostname for every IP address it knows, even for hosts are offline now. Thread will output all of them and mark what hosts was failed to respond ping. The IP scanner also can get MAC address from each host it found. Even if the ping service of host if down, it will still return MAC address.
Image below describes IP scanner thread configuration window.
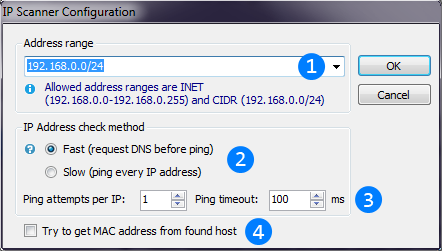 IP address range. Both INET and CIDR address schemes are supported.Radiobuttons switches the scanner to fast or slow modes.These controls allow to configure pings that will be send to detect hosts (or to check hosts in fast mode). Pings count per IP - count of pings will be
sent to detect single IP address. If at least one of them succeed - host will be added to thread result. Ping timeout - time to wait reply for one ping.This checkbox enables retrieving the MAC address for each found host.
IP address range. Both INET and CIDR address schemes are supported.Radiobuttons switches the scanner to fast or slow modes.These controls allow to configure pings that will be send to detect hosts (or to check hosts in fast mode). Pings count per IP - count of pings will be
sent to detect single IP address. If at least one of them succeed - host will be added to thread result. Ping timeout - time to wait reply for one ping.This checkbox enables retrieving the MAC address for each found host.Connection Watcher thread is used to monitor currently opened ports and established connections. It can be configured to notify the different types of connections on different ports.
Image below describes Connection Watcher thread configuration window.
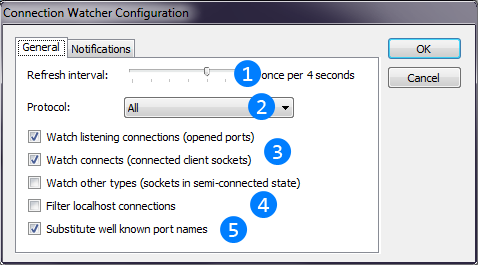 The refesh rate of the connection table. Smaller interval will increase CPU usage and larger interval will made a delay between opening connection/port and the notification.Combobox allows to filter protocols to process. For UDP only listening connections will be shown.This checkboxes allow to filter connection types will be shown in the table.This checkbox allows to filter localhost interconnection (listening for only localhost and established to localhost connections).
 Portname substitution will show the name of well-known ports instead of their names. Enabling this option will increase CPU usage.
In some cases you may need not just to see the table of current connections, but to be notified when some connection of come type and some port appear.
Image below describes how to configure the notification settings of the Connection Watcher thread:
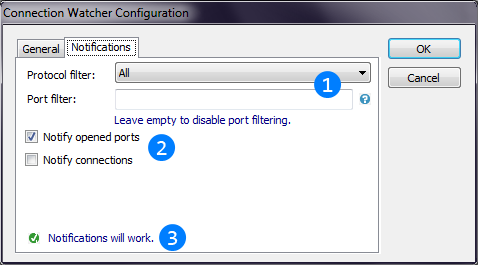 Protocol and port filters allows to filter notifications. For example, thread can show all the protocols in the table,
but notifiy only for TCP. Port filter field uses the same rules as everywhere else. You can set enumaration of ports or port ranges separating them by comma ("80", "80, 8080", "80, 200-250" and etc.).Connection Watcher also allows to filter notifications by the type of connection. Checkboxes allows to enable or disable the notifcations
for opened ports (listening connections) and for established outgoing connections.The comment below tests the current settings and shows errors with notification settings. If some notifications is set, but
the current settings of the Connection Watcher thread mades this notifications impossible, this comment will show this errors.
Protocol and port filters allows to filter notifications. For example, thread can show all the protocols in the table,
but notifiy only for TCP. Port filter field uses the same rules as everywhere else. You can set enumaration of ports or port ranges separating them by comma ("80", "80, 8080", "80, 200-250" and etc.).Connection Watcher also allows to filter notifications by the type of connection. Checkboxes allows to enable or disable the notifcations
for opened ports (listening connections) and for established outgoing connections.The comment below tests the current settings and shows errors with notification settings. If some notifications is set, but
the current settings of the Connection Watcher thread mades this notifications impossible, this comment will show this errors.Connection Watcher thread can be configured in runtime. Connection Watcher is endless, so it can't stop by itself (only with app) but you can stop it manually by clicking "Close" button on its header (See also "Header").
UPnP service threads allows to detect and make some actions with UPnP devices.
See also Wikipedia "UPnP".This thread is used to detect all accessible UPnP devices, its types, subdevices and services.
As Windows provided its own UPnP system and used native UPnP port, AntiFreeze.NET is unable to listen UPnP device advertisement messages. But direct scan can still available to detect all devices connected.
UPnP port mapper thread allows to add port forwarding entry to router or other NAT-providing device with UPnP interface. For further details see Wikipedia "Port forwarding".
Image below describes UPnP port mapper thread configuration window.

Configs list and meanings:
Thread results (success or error) will be printed to main Console.
This thread is used to retrieve port mapping tables for all detected UPnP devices capable of this. Context menu for each mapping entry allows to delete it. To add mapping use "UPnP Port Mapper" thread.
Thread has no settings and works automatically.